
Analyze queues and agents
Select the customer and open Call Center Stats. Read permission for statistics is required. Prepare the period, queues and agents to compare. The screen starts on the last seven days; the former SLA and analytics tabs lead to the queue view.
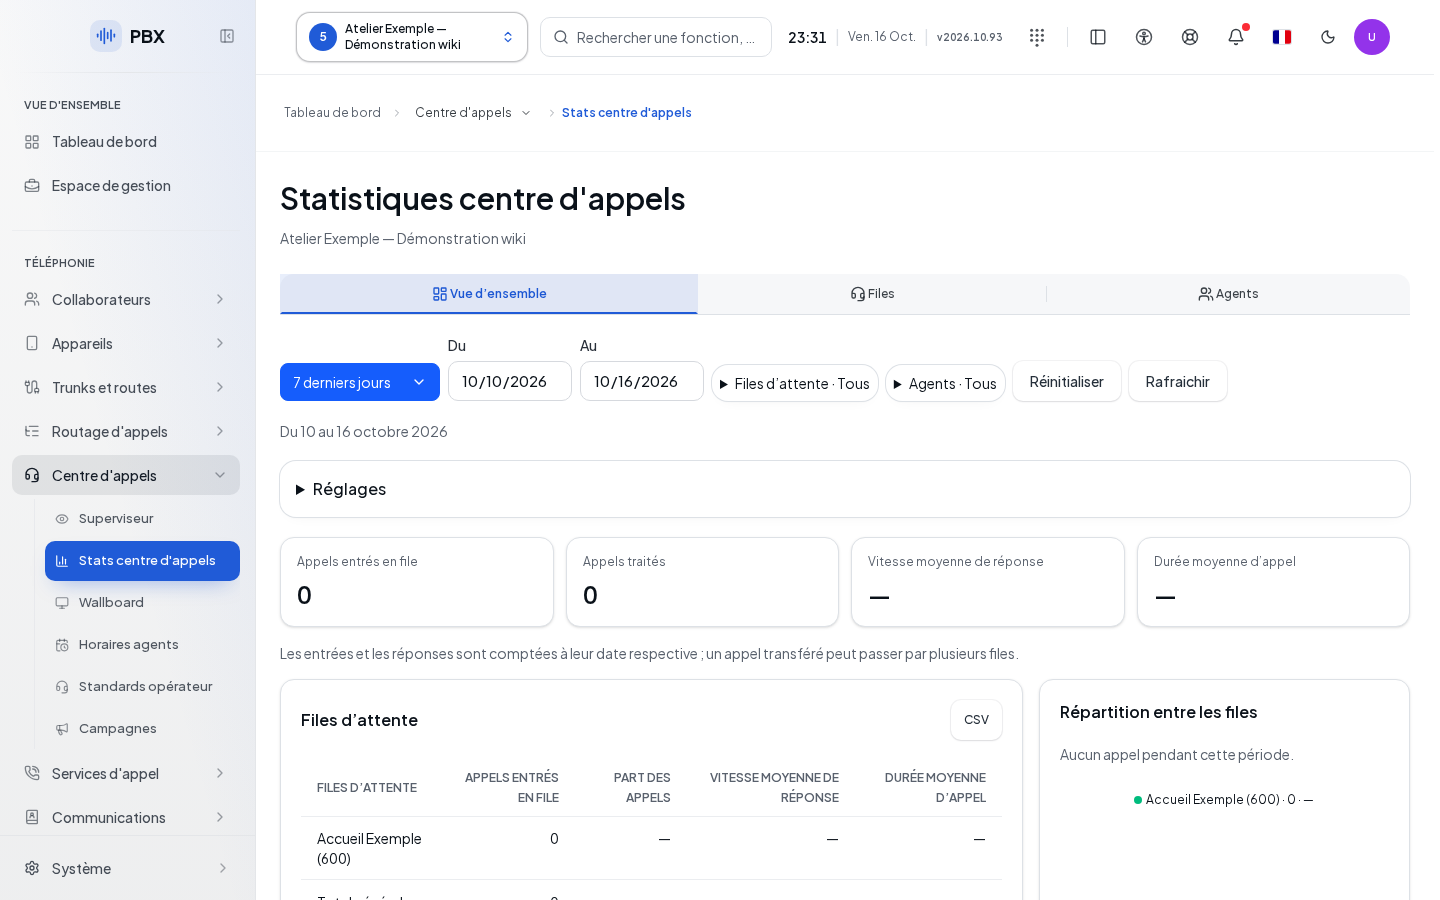
Choose filters
| Field | What it's for | Possible values | Example |
|---|---|---|---|
| Period | Set the dates | Suggested period, or valid From and To | Last seven days |
| Queues | Limit the queues studied | All or selected checkboxes | Reception |
| Agents | Limit the agents | All or selected checkboxes | Morning team |
| Start of day | Limit the time range | Time; 00:00 by default | 08:00 |
| End of day | Close the range | Time; 24:00 by default | 18:00 |
| Days of week | Limit the days | At least one day; all by default | Monday to Friday |
| Service quality threshold | Response benchmark | 20 seconds, read-only | |
| Compared thresholds | Additional benchmarks | 5, 10, 20, 30 seconds, read-only |
Open the queue and agent selectors, then check the desired items; their global command removes the specific selection. The day settings expand below the filters. The reset command restores the last seven days, all agents and queues, all days and the full day. The refresh command reloads the current results.
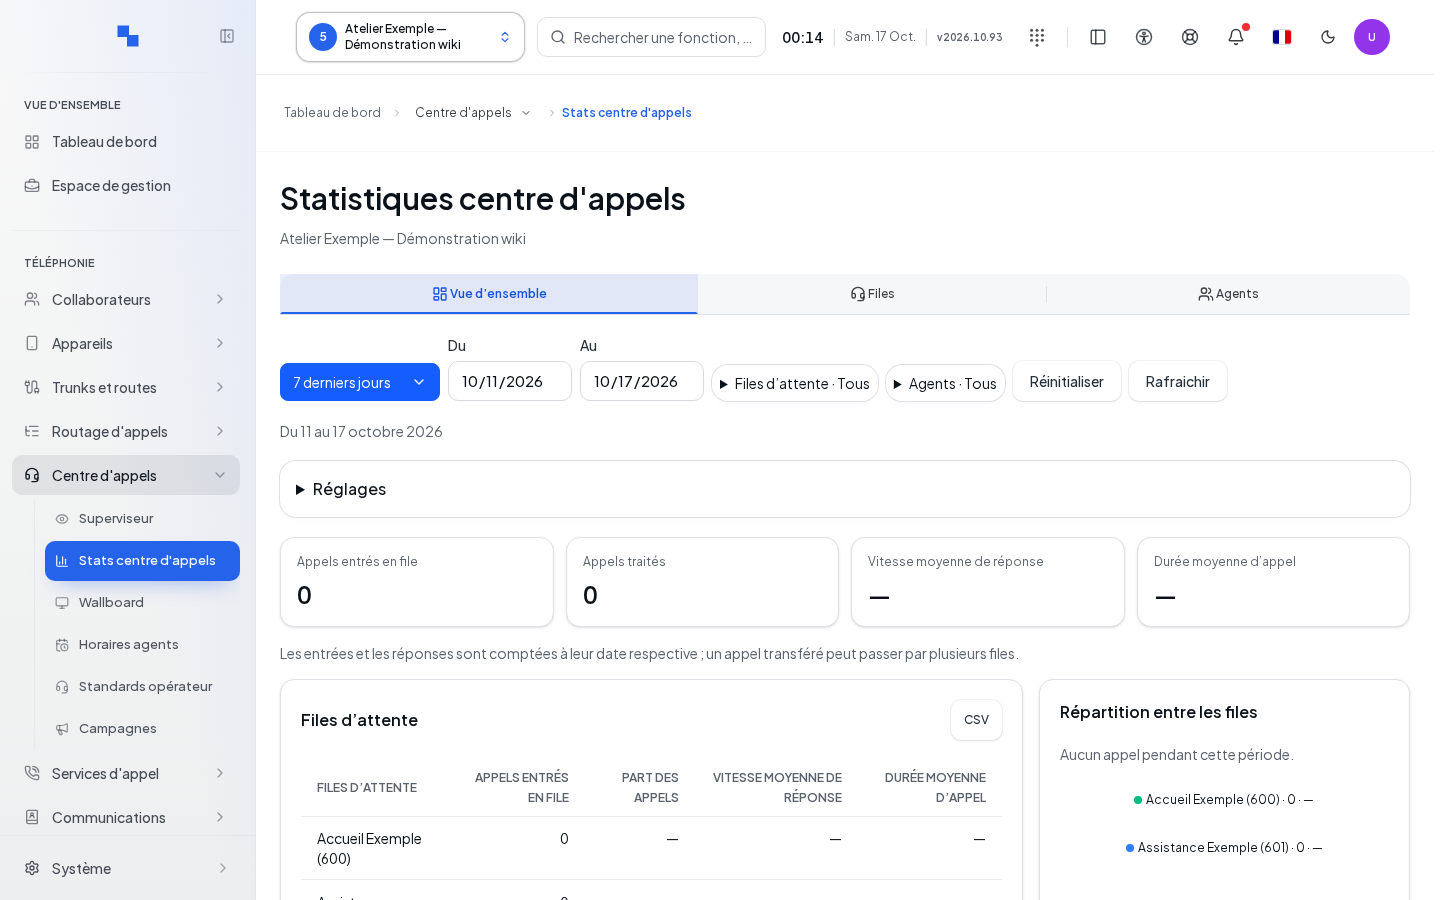
Read the three views
The Overview presents the activity distribution. Open its details for the additional summary. Queues displays queue comparisons; its details group tables, analytics, cohorts and measurement limits. Agents compares agents and offers a live status panel: connected, on break or disconnected, with the number of queues.
The live view does not describe historical presence over the entire period. The service quality metrics use the indicated thresholds; incomplete results are flagged. The performance ranking requires at least five calls handled with known delays and durations. Its score gives the main weight to the number of calls; response speed adds up to 25%, call brevity up to 10%. The score help explains the calculation: use it before comparing agents.
The Export to CSV or CSV commands export the table they are attached to. The analytics detail commands open the relevant supplement; close it to return to the comparison.
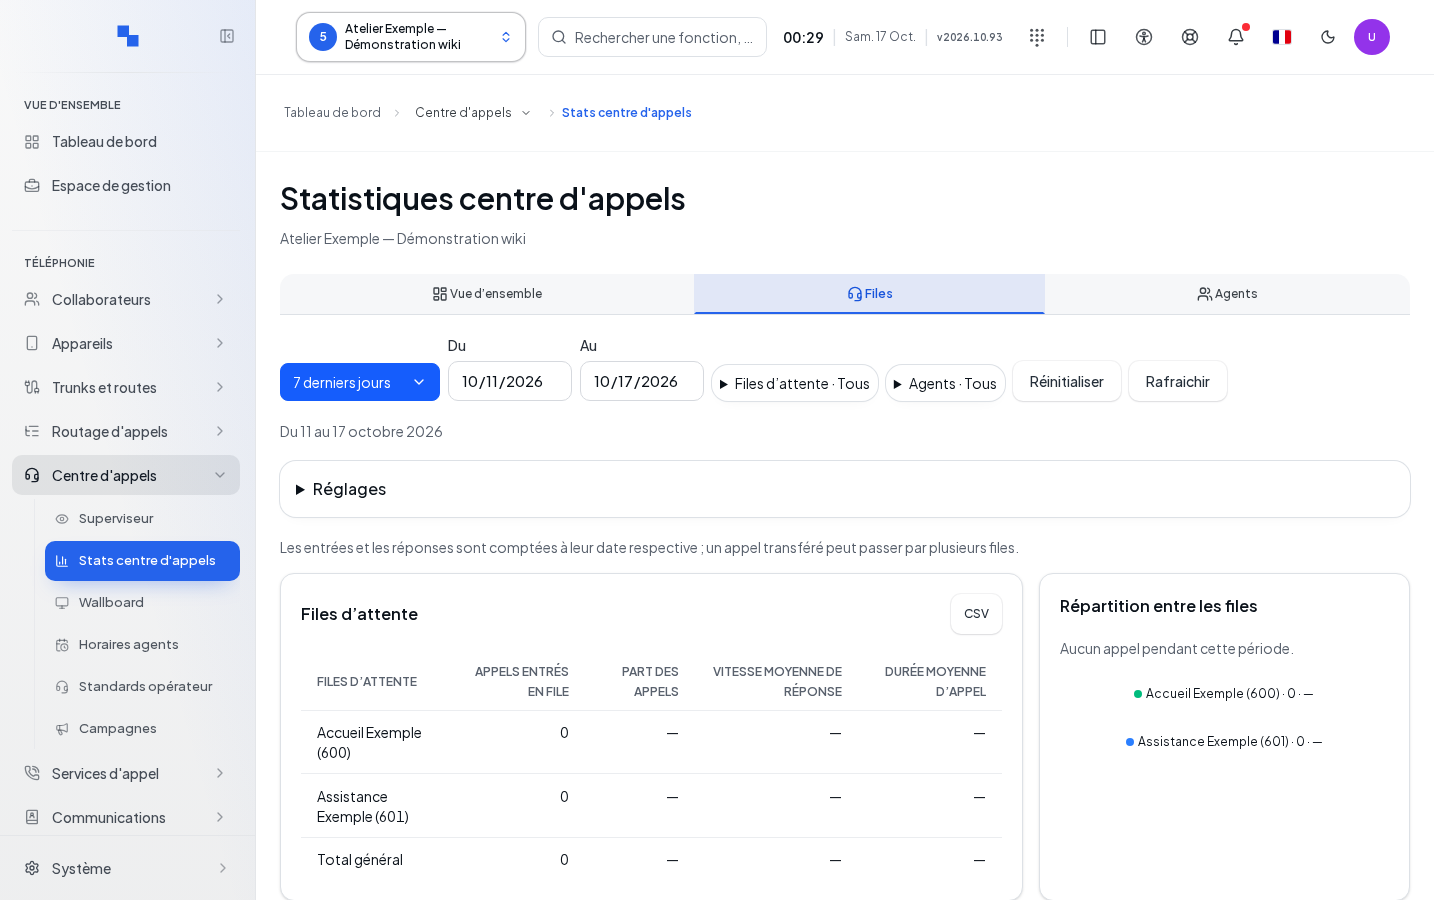
Check the result
Check the displayed period with its time zone, the queue and agent selections, the days and the time range. A missing measurement or incomplete coverage does not constitute a zero. If a date is invalid, correct it; if the reading fails, use the refresh and keep the returned message. To act on agent presence, see Supervisor.