
Open advanced diagnostics
This page is intended for the installation administrator. Open System → Queues and webhooks, in the Diagnostics group. The sections are Queue recovery status and Temporary webhook logging. The old queue diagnostics entry leads here.
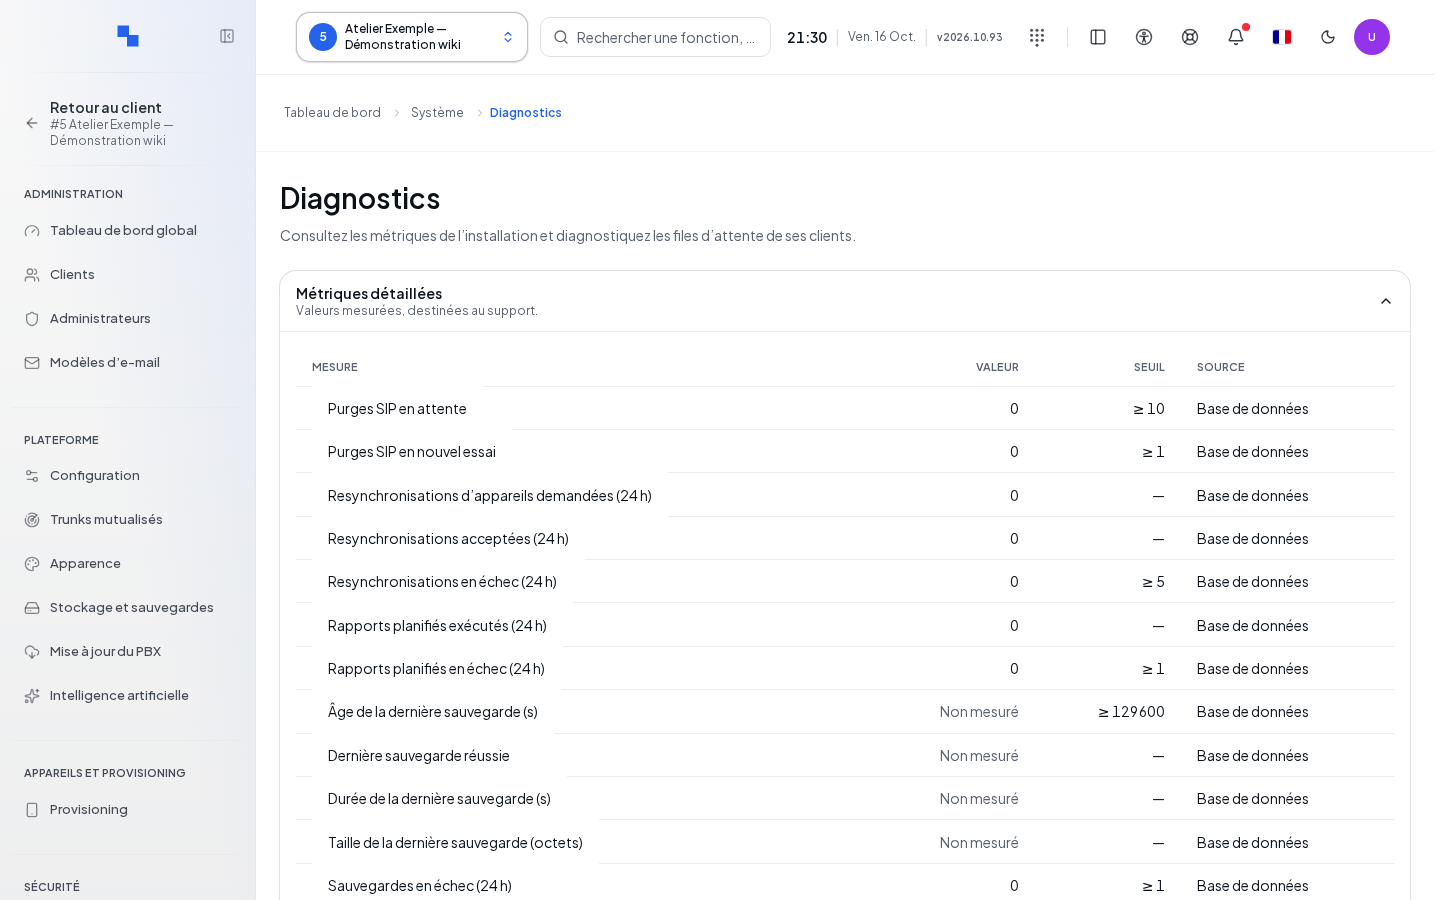
Read detailed metrics
Open Metrics to go to Services and incidents → Metrics. The table shows measurement, value, threshold and source. A measured value is highlighted when it reaches a positive threshold. A missing threshold is shown with a dash.
A measurement is only usable if its status and date are valid and its value is non-negative. A measurement older than two minutes is marked as not measured. Timestamp values are displayed as dates; other values use their numeric format. The technical name is available as a tooltip for support purposes.
Review a queue's recovery
| Field | Purpose | Possible values | Example |
|---|---|---|---|
| Customer | Choose the scope | Available customer | Example Workshop |
| Queue | Choose the inventory | Queue of the selected customer | Reception |
| Phase | Limit the processing step | Available phases, or all | Phase matching the incident |
| Status | Limit the diagnostic | Available statuses, or all | Items to review |
- Select the customer, then the queue.
- Wait for the inventory to fully load.
- Filter by phase and status if needed.
- Read the channel, durable phase, admission, deadline, diagnostic and its reasons.
- Use the tooltips to find the owning process and the observed status of the channel or call bridge.
- Browse through pages and retry loading using the command offered after an error.
This inventory is a read-only diagnostic. It does not constitute a command for manually recovering calls.
Temporarily log webhooks
A webhook sends a notification to external software. In Temporary webhook logging, choose a duration then enable detailed logging. The action is immediate; it does not require Save. Check the displayed status and end time. Disable it as soon as the diagnostic is complete; it also expires automatically.
| Field | Purpose | Possible values | Example |
|---|---|---|---|
| Duration | Limits the logging | Durations offered by the list | Duration covering your test |
Logging records identifiers and metadata such as the method and content type. It does not include the body, URL or secrets.
Check the result
Check the customer, queue and freshness of the observations before reporting a finding. A partial or failed read does not prove the absence of recoverable calls. Report the displayed reasons and the time of the incident to the integrator. For overall health, see Services and incidents.
If this does not work
Retry loading after an error and check the selected customer and queue. For a logging command that is denied, check your permissions and the displayed message. Do not interpret a failed read as an empty inventory.