
Opening Your TV Supervision Dashboard
The supervision dashboard displays live queue data for a wall configured by your administrator. Open it with Full screen from the wall list, or using its TV display address, from an authorized session. Without a valid session, this display redirects to the login page. For a TV without a session, use the public link created by the administrator instead. New public links have no expiration date and remain active until revoked, subject to authorized networks and the existence of the wall.
The link must designate an existing wall. If the wall has been deleted or the link is incomplete, the screen indicates this and offers Back to the wall list.
The wall follows the light or dark theme of the interface; changing the theme on the wall also changes it in the interface. Choices made on the wall (screen, queue, scrolling, tint, theme) are added to the page address: save this link on the TV to get the same display the next time it starts.
Switching Screens and Queues
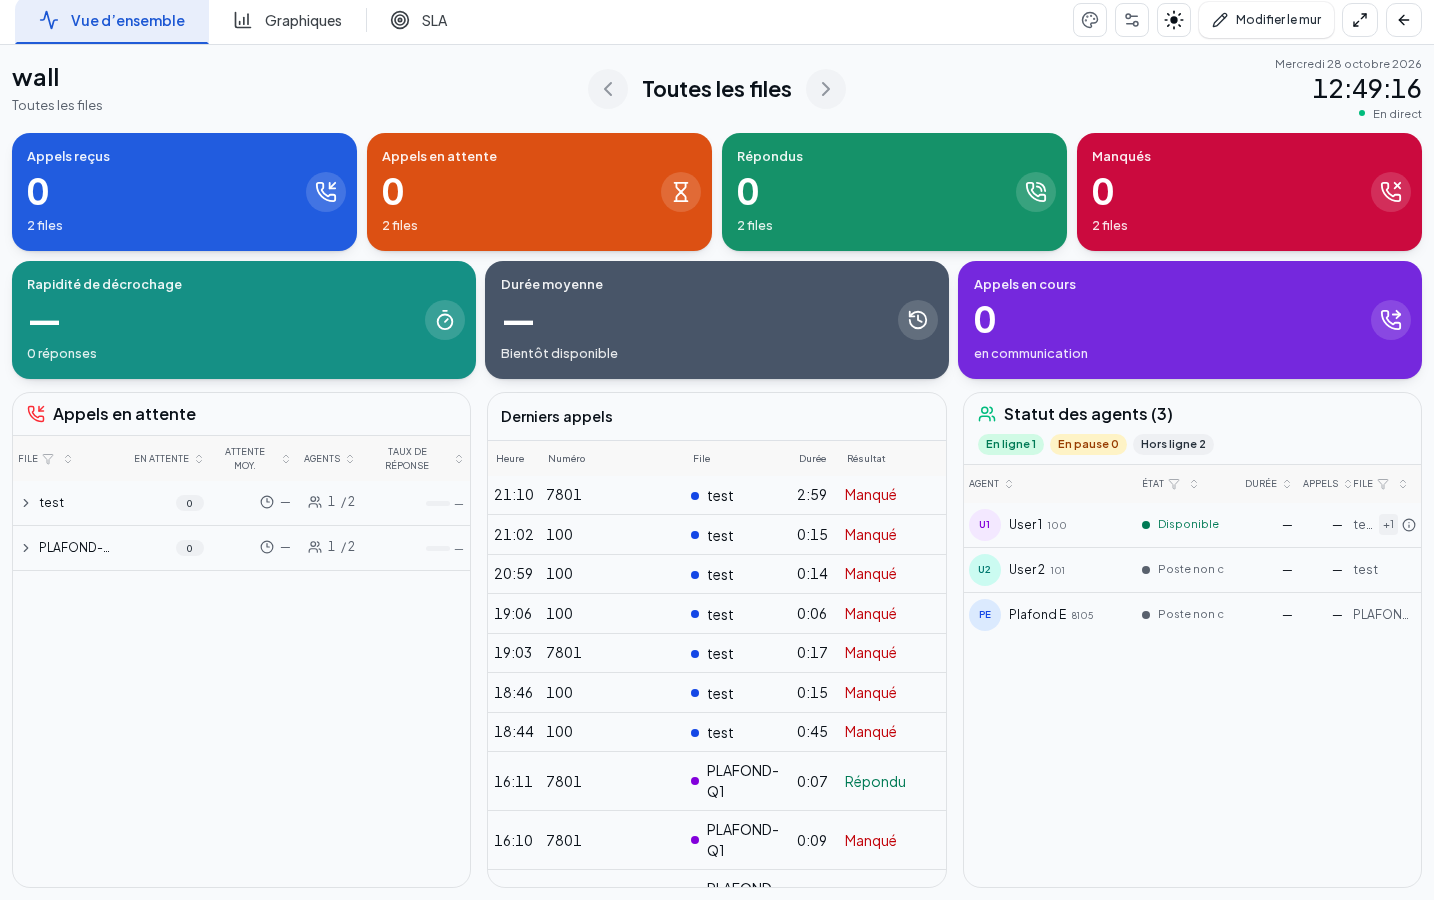
- Choose a screen from the tabs at the top left, for example Overview, Charts, or SLA.
- Check the wall name, then the queue displayed below; All queues groups the wall's queues and counts unique calls in the totals.
- Switch between queues using the Previous and Next arrows in the center, or the left and right arrow keys on the keyboard.
- Check the date, time, and playback status on the right.
| Screen | What You're Reading |
|---|---|
| Overview | Tiles for Calls received, Calls waiting, Answered, Missed, Answer speed, Average duration, and Calls in progress; table of waiting calls by queue, expandable to see each call; Latest calls with time, number, queue, agent, duration, and outcome (answered, overflow, answered after fallback, no answer, or undetermined outcome depending on data); Agent status with their state, duration in that state, their calls, and their queues |
| Charts | Calls per hour for the day, Queues (received, answered, missed by queue), Answer speed, Answer rate, Agent status, and Live activity over the last few minutes |
| SLA | Today's service level compared to targets, table by queue, and hourly trend |
In Latest calls, Agent displays the name recorded at the time of the answer in the queue. Without an answer in that queue or without a recorded name, the cell displays "—", notably for an answer after fallback.
While a new call is ringing, answers and missed calls already established remain displayed. Answer rate uses calls with a known outcome; calls still without an outcome are excluded. Without a resolved call, it displays "—". A ringing call is not an ongoing conversation. A caller hanging up ends their wait and the distribution attempts.
Compact lists display more rows. Long identities may be truncated: hover over them to read them, and scroll the panel to reach other rows.
Table columns can be sorted with a click on their header; the funnel icon filters, for example by agent status. Your administrator can add other screens or other elements, such as the Agent ranking of the day.
| Status Displayed Top Right | Meaning | What to Do |
|---|---|---|
| Live (green dot) | All readings are recent | The figures are usable |
| Waiting for data… | No reading received yet | Wait before interpreting the figures |
| Daily counters are unavailable. | Live figures are read, not daily figures | Daily tiles display "—" |
| Refresh interrupted: {files} (red dot) | Reading of one or more queues failed; their names replace {files} |
Have the connection checked |
| Queues are unavailable. | The wall's queue list could not be read | Reload the page, then notify the administrator |
A value of "—", or Unknown on the SLA screen, means that data collection is incomplete or too old. This is not a zero. A one-time failure between two successful readings does not make the figures disappear: they remain displayed as long as the last reading is less than fifteen seconds old.
The Average duration tile indicates the average conversation duration of answered queue calls, measured on the agent's segment in completed calls. Time spent in the voice server and the conversation following a transfer are excluded. Without an attributable measurement, it displays "—". A duration measured as zero is included; a missing or ambiguous duration is excluded.
The Agent ranking of the day and queue statistics use the same conversation measurement, for their respective scope. With identical scope, the value is the same. For multiple queues, the average is weighted by the number of measured conversations, not by all answered calls. The number of answers shown under the tile corresponds to answers that have a conversation measurement.
"Unavailable on this PBX." in Latest calls indicates that your phone server does not provide the necessary details; this is not a failure.
Adjusting the Display
Controls are located at the top right, in a toolbar with borderless buttons.
| Control | Effect |
|---|---|
| Color tint | Tints the wall background with its accent color; the choice is retained on this screen |
| Auto scroll | Opens scrolling options: Auto scroll cycles through queues one after another, Scroll screens cycles through tabs, Scroll interval sets the pace (5, 10, 15, 30, or 60 s) |
| Sun / moon | Toggles between light theme and dark theme |
| Edit wall | Opens edit mode, with write permission and on a computer screen; see Wallboard |
| Full screen / Exit full screen | Adapts the display for the TV |
| Back | Opens the wall list |
On a computer with write permission, + after the tabs adds a screen according to the chosen template, up to a limit of eight. The cross on a tab opens Delete screen: check the name and confirm, or cancel. The last screen cannot be deleted. These actions prepare a draft: Save keeps it, Cancel restores the saved wall. On the SLA screen, Configure SLAs opens the common targets; a queue's name allows setting its own targets. See wallboard procedures.
Scrolling pauses during a wall edit or target entry. The browser may refuse full screen without preventing the dashboard from being read.
Checking the Result
Check that the time is advancing, that Live remains displayed, and that the arrows offer the expected queues. Let scrolling run once to check each screen.
If This Doesn't Work
Without an identifier, with an invalid identifier, or a wall not found, use Back then open the current wall. In case of access denial or reading failure, send the administrator the message displayed at the top right. An indicator at zero with Live is an actual measurement; a "—" is a missing measurement.
Distinguishing Overflows and Missed Calls
Overflowed means the call went to another queue. An exit to another destination is not, by itself, an overflow. Missed means no one answered the call from start to finish, including after fallback. Pickup by a voice menu or voicemail does not constitute a human answer.
Within a queue, an answer on the spot and an answer after fallback are distinguished. In the totals of the connected wall, each call counts only once among the selected queues. Example: a call enters A, overflows to B, and is answered there. A counts an overflow, B an answer; the total counts one call received, one answered, one overflowed, and no missed. Answered and overflowed can therefore refer to the same call: do not add them together to get the number of calls received.
A call still in progress or old data without sufficient proof remains undetermined. A "—" value is not equivalent to zero. Abandonments observed in historical charts should not be automatically equated with missed calls. The service level per queue measures the wait in that queue; the overall level requires a measurement of the delay from the first selected entry to the human answer.